


Officials have tried almost everything to quell the community spread of COVID-19, from requiring face masks to canceling 4th of July fireworks that could have drawn a crowd. Regardless, between June 1 and July 20, Monroe County cases have spiked 720%.
The data starts on June 1, the day the checkpoints came down at the top of the Keys and visitors were welcome in the Keys again. The X-axis denotes five data points (see Key below): Cases in Monroe County as a total including visitors, cases in Key West, and cases in the rest of Monroe County, excluding Key West. It also shows the number of deaths in Monroe County, although it has been noted recently that there is a lag in the reporting of that number. Finally, the Keys did not begin reporting current hospitalizations (as compared to aggregate over time) until June 19. The Y-axis tracks events over time.
All of the data is based on the daily reports from the State Department of Health in Monroe County. The chart details data through July 20.
— Sara Matthis, Tiffany Duong and graphic by Javier Reyes
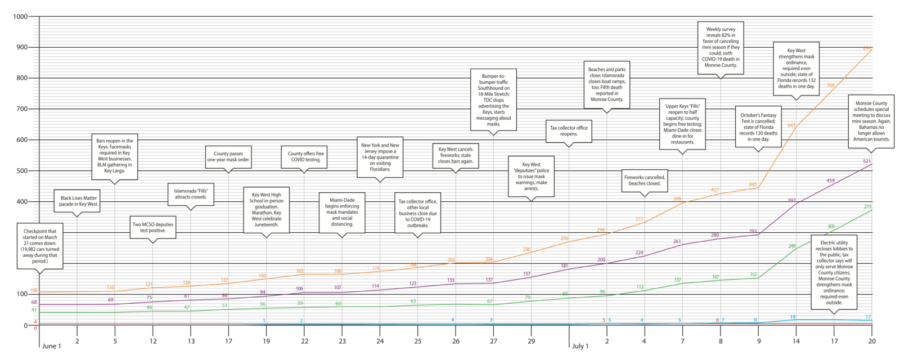
Key:
Orange: Total cases in Monroe County
Purple: Cases in Monroe County, excluding Key West
Green: Cases in Key West
Blue: Hospitalizations
Red: Deaths
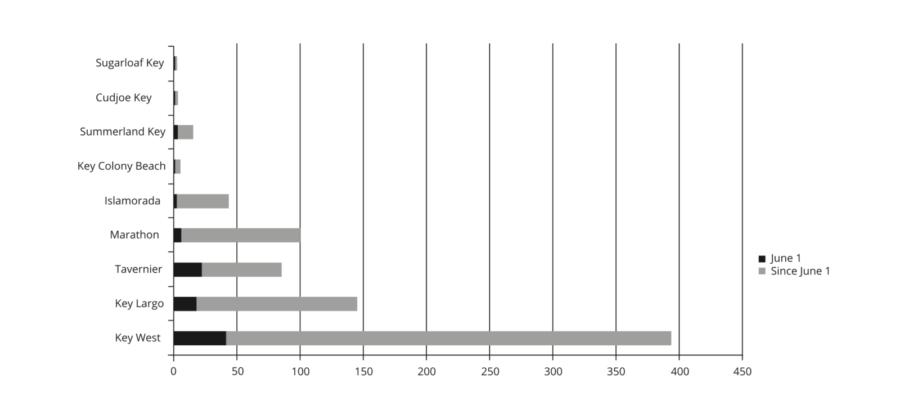
This graph shows the rise in cases per community in the areas most affected in the Florida Keys beginning on June 1. For example, Key West had 41 cases on June 1 and 394 cases on July 20. Although there are now cases in places like Big Pine Key, there were none on June 1.


